How To Tell Your Website's Device Split
If you've been following our previous guides, how to find your organic traffic in google analytics and how to find your popular keywords in search console, then you should have a solid idea of what your traffic consists of. But that's not all! A big part of understanding this traffic is know how they're searching. Searches conducted on a desktop are very different when compared to searches on a mobile. Think about your own searches for a second. Being on the move and searching for something on your phone is a very different mindset than when you're looking for something on a desktop computer. This is something we often cover in our Marketing Opportunity Analysis.
So, in today's guide, we're going to run through how to find out your "device split" in google analytics.
Step 1: Log In to Your Google Analytics
We've covered this in a previous guide, and if you're already logged into Google Analytics, then we recommend you go back to our first guide and start there, you'll learn a lot about the importance of measuring your traffic and how you can find your organic search figures.
Step 2: Navigate to Device Split
Second step and we're already there. Once you're in Analytics, it's pretty simple to find out your website's device split.
Navigate to "Audience". Once the options have appeared below it, open up "Mobile" and then click "overview".
Here you'll be met with some numbers and percentages for your audience's device split.

In our example above, you can see that this website has 55% Desktop, 41% Mobile and 4% Tablet traffic.
Some things to note...
Step 3: Check the date
You can see in the example above that there's not actually a huge amount of data – only a total of 620 sessions. This is because we're only looking at a short period of time and we need to adjust our date range.
For this, we're going to look at the previous 12 months.
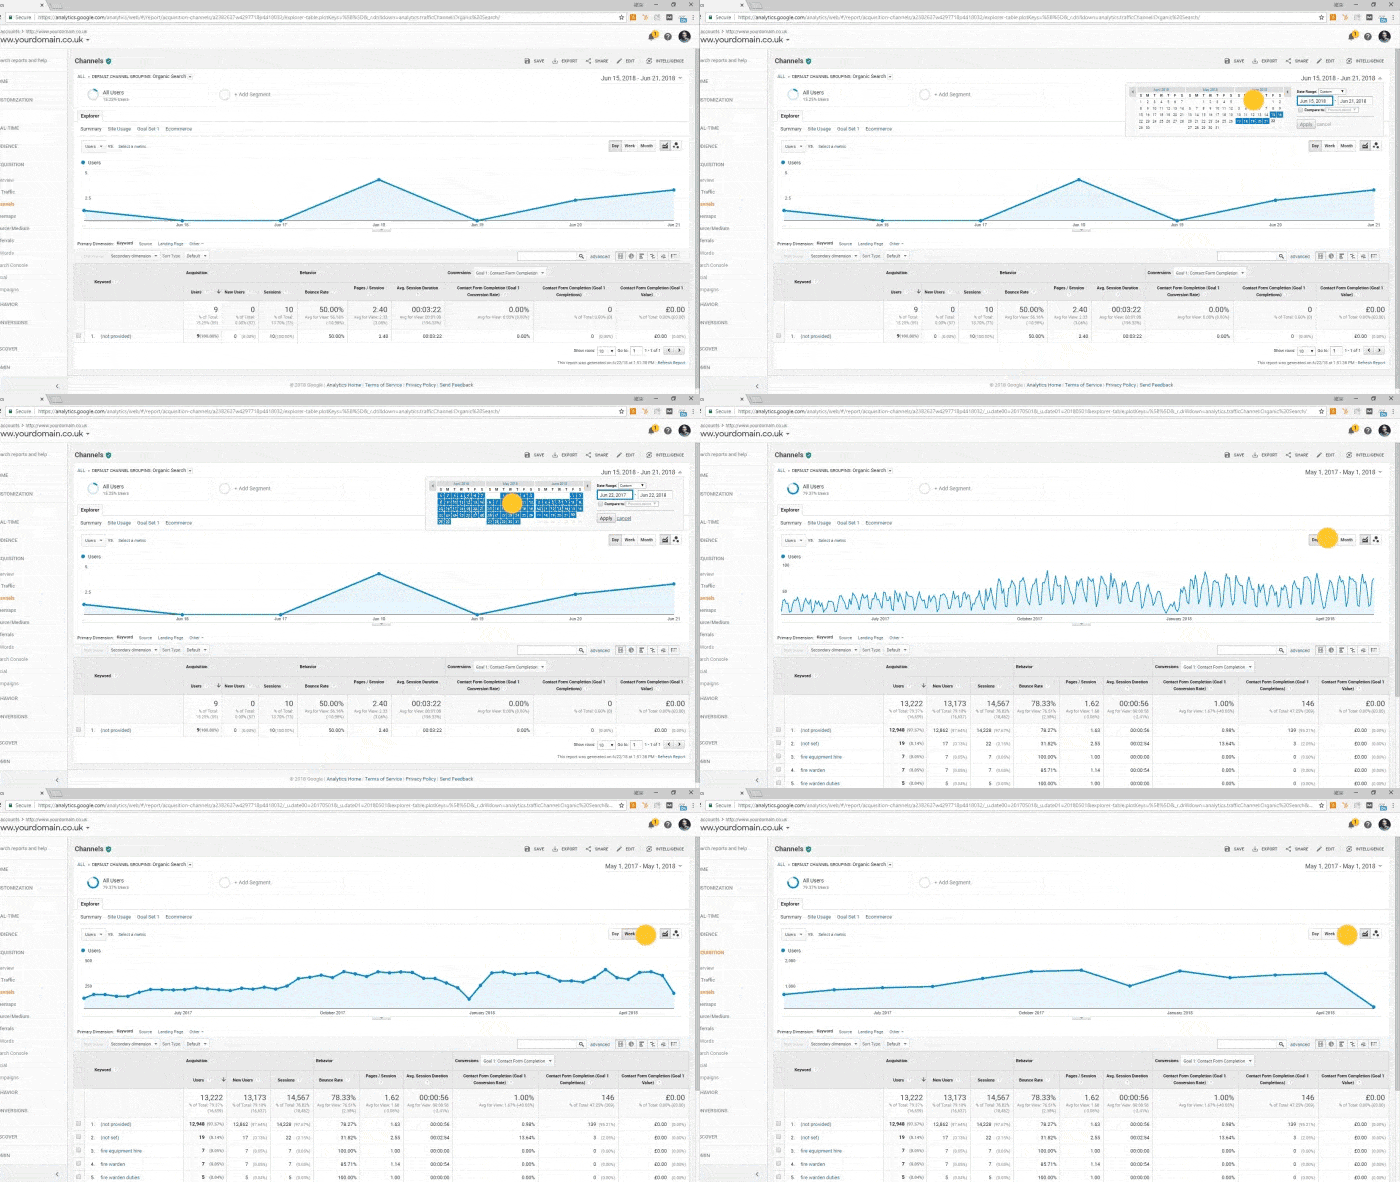
Changing the date is the same as the process below:

Now you can see that we've got a much larger audience and we have a better representation of the website's actual performance.
Step 4: Look at the trends
Now you're looking at a longer period, you can hopefully see a traffic trend, but what about each device?
Next to each device you'll see a little check box. Check each box and hit the "plot rows" box above.

When you plot the rows, you'll suddenly see each individual device plotted on the graph, along with the "total".

Here we can see that both Desktop and Mobile sessions are growing and contributing to the overall growth in organic and a similar rate.
Step 5: Adjust your Audience
It's important to note here that we're looking at the whole of the website's traffic. However, from previous tutorials you will know that website traffic doesn't consist of only organic traffic.
If you want to look at just organic traffic we can adjust the audience to do so.

Click on this audience to change it and do two things.
Unselect "All Users" from the top of the list.
Then, search in the top right for "Organic Traffic".

Select the checkbox next to it and hit the "Apply" button.
You should now only have an "organic traffic" box at the top, and it will be showing you the device split for only organic traffic.
Enjoy the helpful insight that this gives you.


